More Information on Greenhouse Gas Emissions
Like all industrial facilities engaging in combustion, coke oven manufacturers generate greenhouse gases, specifically carbon dioxide and methane. The amount of carbon dioxide generated from coke ovens is less than 5% of that generated by the iron and steelmaking industry, which in turn is less than 1% of all carbon dioxide generated in the United States. Accordingly, the protection of public health presents a stronger case for more stringent regulation of coke ovens, than global warming. It should be noted that greenhouse gases from steelmaking operations (which use the finished coke product as fuel) are more significant than those from the coke manufacturing sector.
Source: Inventory of U.S. Greenhouse Gas Emissions and Sinks: 1990-2014 (pages ES-5 through ES-8, Section 4.16, pages 4-56 to 4-66)
EPA’s national greenhouse gas inventory provides data on greenhouse gas emissions from different sectors of the economy. The most recent year for which data are available is 2013, although EPA has proposed a revision in February 2016, to provide data for the year 2014. Because coke is produced as a fuel for the iron and steel industry, the inventory includes data on coke oven emissions from metallurgical coke production (that is, coke manufacturing) as well as greenhouse gas emissions from iron and steel production.
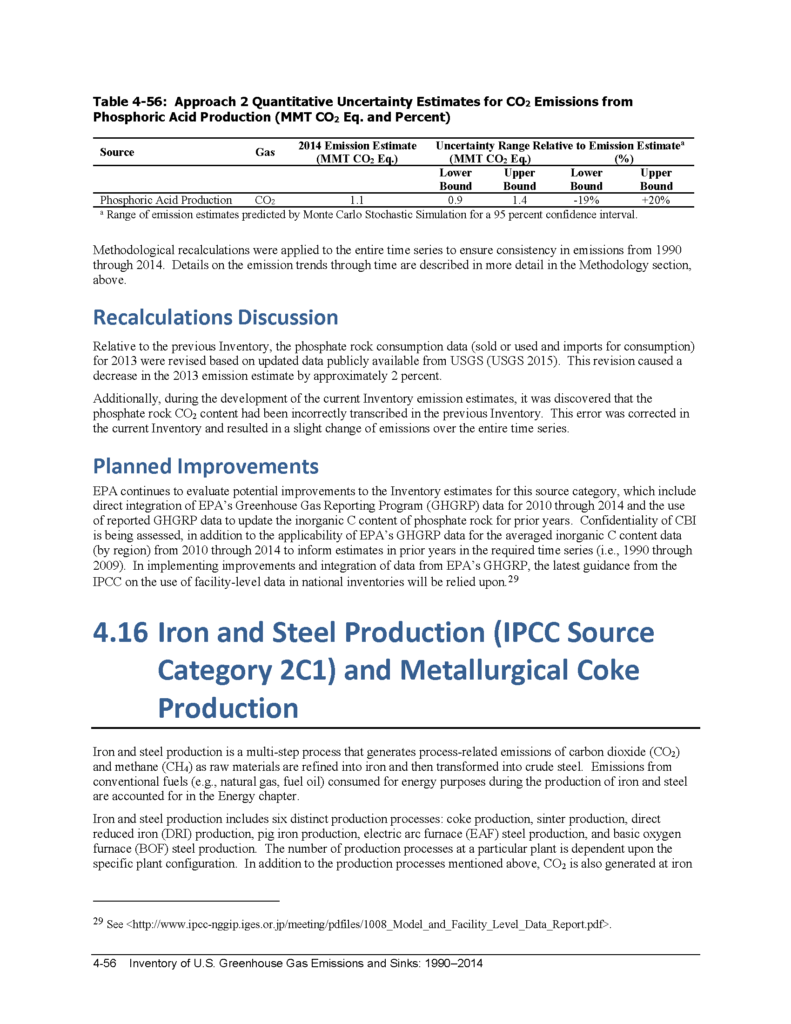
It is important to understand that the data do not include emissions from conventional fuels consumed for energy purposes by the iron and steel industry, which are accounted for separately in the section of the report relating to energy. (p. 4-56) (“Emissions from conventional fuels (e.g., natural gas, fuel oil, etc.) consumed for energy purposes during the production of iron and steel are accounted for in the Energy chapter”).
“Iron and steel production includes six distinct production processes: coke production, sinter production, direct reduced iron (DRI) production, pig iron production, electric arc furnace (EAF) steel production, and basic oxygen furnace (BOF) steel production.” (p. 4-56)
1. Metallurgical Coke Production
The inventory separates greenhouse gas emissions for metallurgical coke production from other greenhouse gas emissions from the iron and steel industry. (p. 4-57 through 4-66)
| CO2 emissions: | 1.9 MMT CO2 Eq. |
| CH4 emissions: | — |
| Total emissions: | 1.9 MMT CO2 Eq. |
2. Iron and Steel Production
While the coke manufacturing process itself does not generate a large portion of carbon dioxide emissions from the iron and steel sector, much of the carbon dioxide emissions from the iron and steel manufacturing process are attributable to the use of the coke as a raw material. Page 4-57 (“The majority of CO2 emissions from the iron and steel production process come from the use of coke in the production of pig iron and from the consumption of other process byproducts, with lesser amounts emitted from the use of flux and from the removal of carbon from pig iron used to produce steel.”).
In the case of CO2, the emissions from metallurgical coke production are less than one-twentieth of the emissions from iron and steel production. In the case of CH4, the emissions from metallurgical coke production are less than one-tenth of the emissions from iron and steel production.
| CO2 emissions: | 53.4 MMT CO2 Eq. |
| CH4 emissions: | 0.4 MMT CO2 Eq.* |
| Total emissions: | 53.8 MMT CO2 Eq. |
* Greenhouse gases do not have the same Global Warming Potential (potential for increasing the heat on the surface of the planet). To make comparisons easier, EPA has assigned a unit value of 1 to refer to the Global Warming Potential for carbon dioxide, and assigned multipliers for other greenhouse gases. For example, methane has a Global Warming Potential that is 20 times the Global Warming Potential of carbon dioxide. As a result, the inventory converts emissions calculations for methane into equivalent amounts of carbon dioxide emissions.Total Emissions
4. CO2 Emissions: National Contributions
| Metallurgical Coke and Iron and Steel: | 55.4 MMT CO2 Eq. |
| All Sectors: | 5,556.0 MMT CO2 Eq. |
5. CH4 Emissions: National Contributions
| Metallurgical Coke and Iron and Steel: | <0.05 MMT CO2 Eq.* |
| All Sectors: | 730.8 MMT CO2 Eq. |
*Appears to be an error; should read “0.4 MMT CO2 Eq.”