More Information on Public Health Resources
The following links provide additional resources regarding public health impacts in Allegheny County.
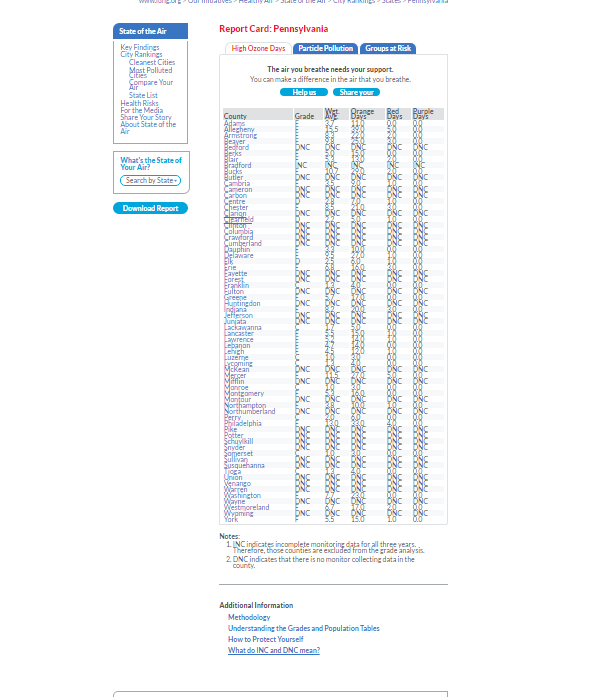
1. American Lung Association: State of the Air Report.
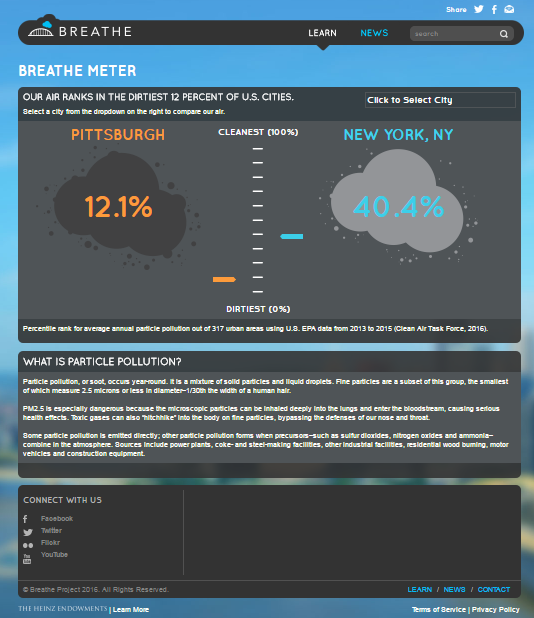
Allegheny County received a failing grade (F) for ozone, particle pollution (PM-2.5, 24-hour), and particle pollution (PM-2.5, annual) from the American Lung Association in 2016. Allegheny County was ranked as the twelfth (12th) most polluted county in the country for annual particle pollution.
American Lung Association: State of the Air Report 2016:
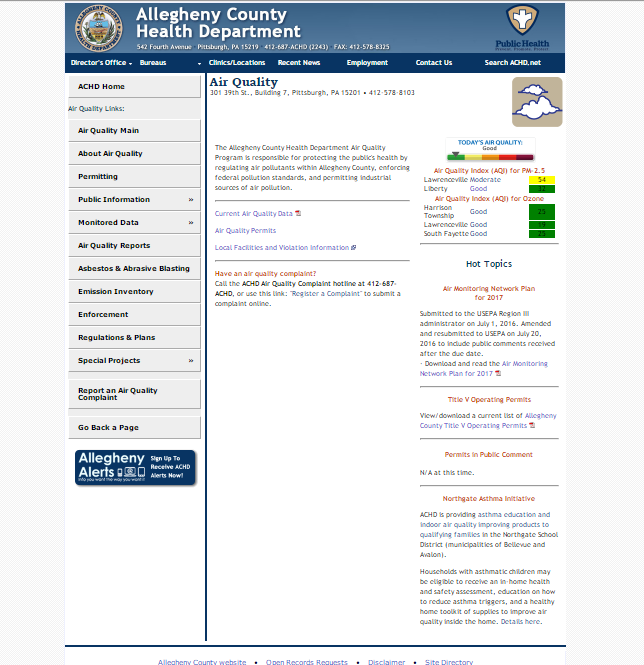
2. Allegheny County Air Quality Program Daily Air Quality Index for PM2.5.
The agency’s website provides daily PM2.5 readings from the Lawrenceville and Liberty air monitors. (The Liberty monitor is located near the Clairton coke facility). Based on the readings, a numerical value is assigned to air quality each day. Based on this numerical value, each day is classified as good, moderate, unhealthy for sensitive groups, unhealthy, very unhealthy, or hazardous.
Allegheny County Air Quality Program Daily Air Quality Index for PM2.5:
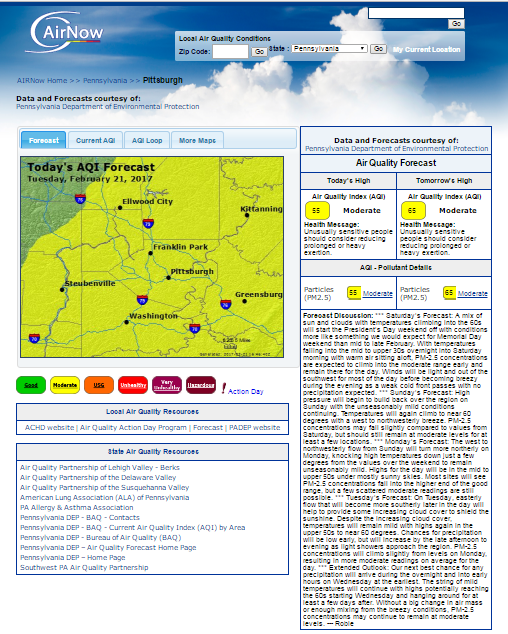
3. Airnow.gov.
This website provides the Air Quality Forecast for the Pittsburgh area, using data from the Pennsylvania Department of Environmental Protection. It displays the current Air Quality Index, which is also separated into specific PM2.5 and ozone AQI ratings.
Airnow.gov:
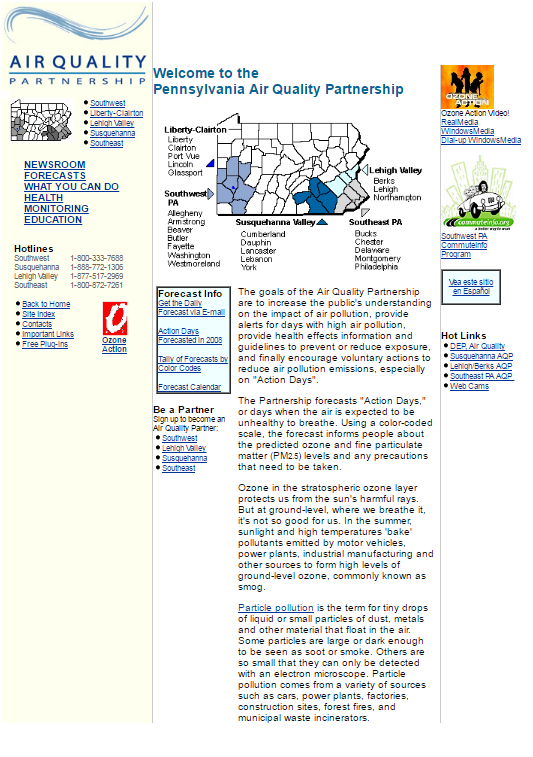
4. Pennsylvania Air Quality Partnership:
The goals of the Air Quality Partnership are to increase the public’s understanding of the impact of air pollution, provide alerts for days with high air pollution, provide health effects information and guidelines to prevent or reduce exposure, and encourage voluntary actions to reduce air pollution emissions, especially on “Action Days”.
The homepage contains links to the daily “PM2.5/Ozone” Air Quality Index for four areas of Pennsylvania:
Southwest (Allegheny, Armstrong, Beaver, Butler, Fayette, Washington, Westmoreland),
Liberty-Clairton (Liberty, Clairton, Port Vue, Lincoln, Glassport),
Susquehanna Valley (Cumberland, Dauphin, Lancaster, Lebanon, York),
Lehigh Valley (Berks, Lehigh, Northampton), and
Southeast (Bucks, Chester, Delaware, Montgomery, Philadelphia).
Pennsylvania Air Quality Partnership:
5. The Breathe Project and the “Breathe Cam”:
The Breathe Project website provides four separate live video feeds of panoramas of various areas in and around Pittsburgh. These cameras are positioned on the North Shore, Downtown, in the Mon Valley, and in Oakland.
The website allows the user to switch between these four livestreams in real time. Along with each livestream, the data from various air monitoring stations are presented just below the livestream. Data are included for the following monitors: Avalon, Lawrenceville, Flag Plaza, Liberty, Lincoln, and Braddock.
The Breathe Cam site also compiles time lapse videos of “notable” air quality events, including smog, “brown cloud,” and poor visibility days.
The Breathe Project and the “Breathe Cam”:
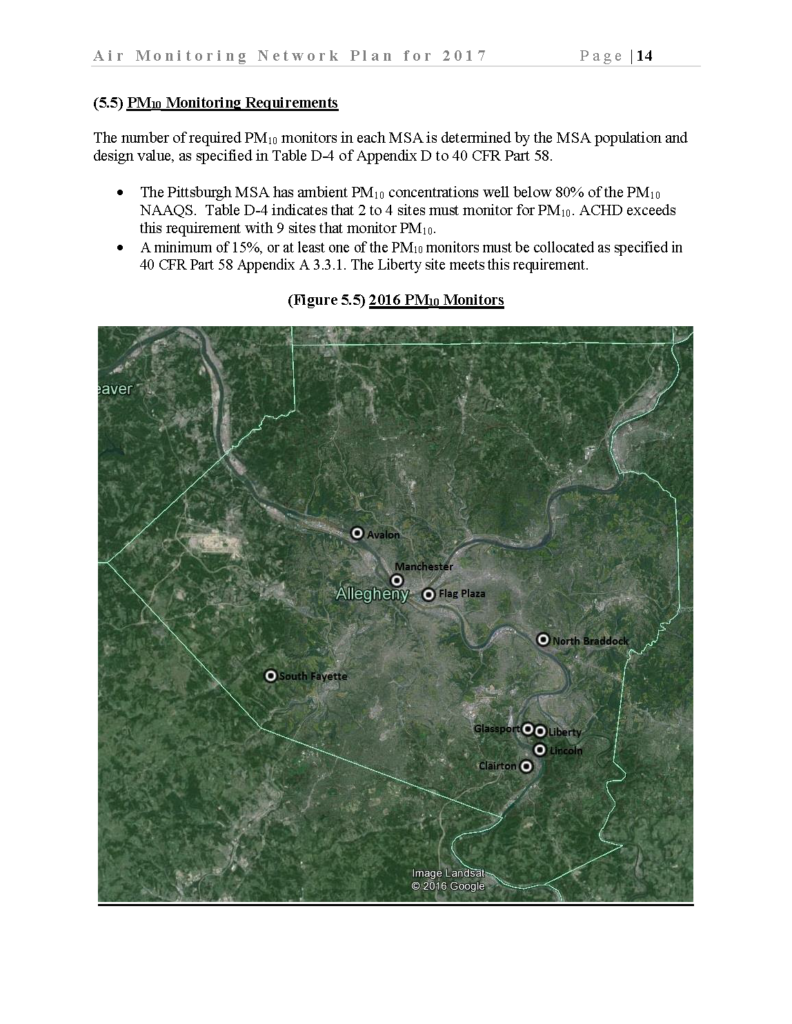
6. 2016 Allegheny County Health Department Air Monitoring Network Plan.
Every year the agency publishes an air monitoring network plan, to present its strategy for monitoring for air pollutants throughout the county.
2016 Allegheny County Health Department Air Monitoring Network Plan: